
Research
Academic Research
As a researcher in the Laboratory of Geoinformatics and Geospatial Information Infrastructure, my research covers the many faces of geospatial data acquisition, analysis, visualisation and their utilisation.
My works can mostly be found on my Github page. Other works on visualisation can also be found here: My Observable Page.
Over the course of my PhD, I have developed a sequence of interactive visual analytics approaches to support local decarbonisation planning and energy transition decision-making. My early work focused on gridded-glyphmaps for geographic multicriteria decision analysis, using multivariate geospatial visualisations to highlight suitable locations for decarbonisation and to support transparent stakeholder discussion.
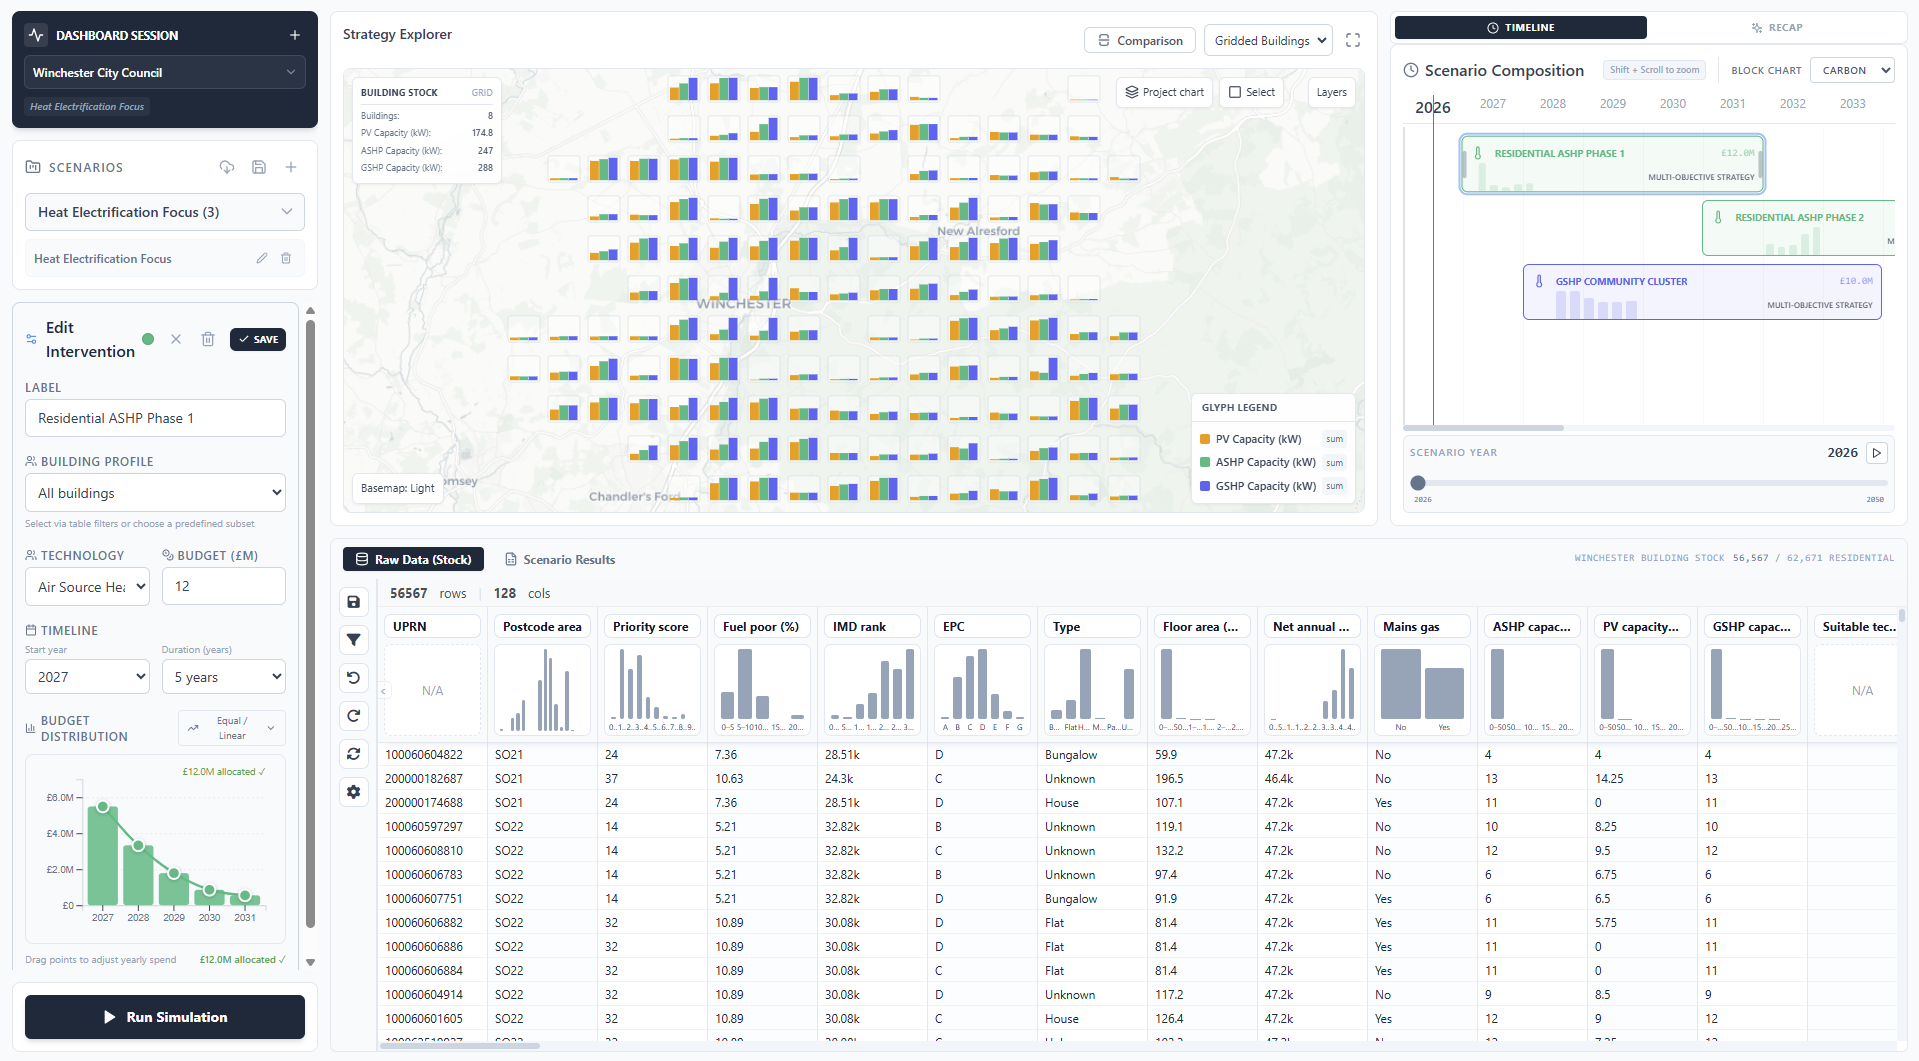
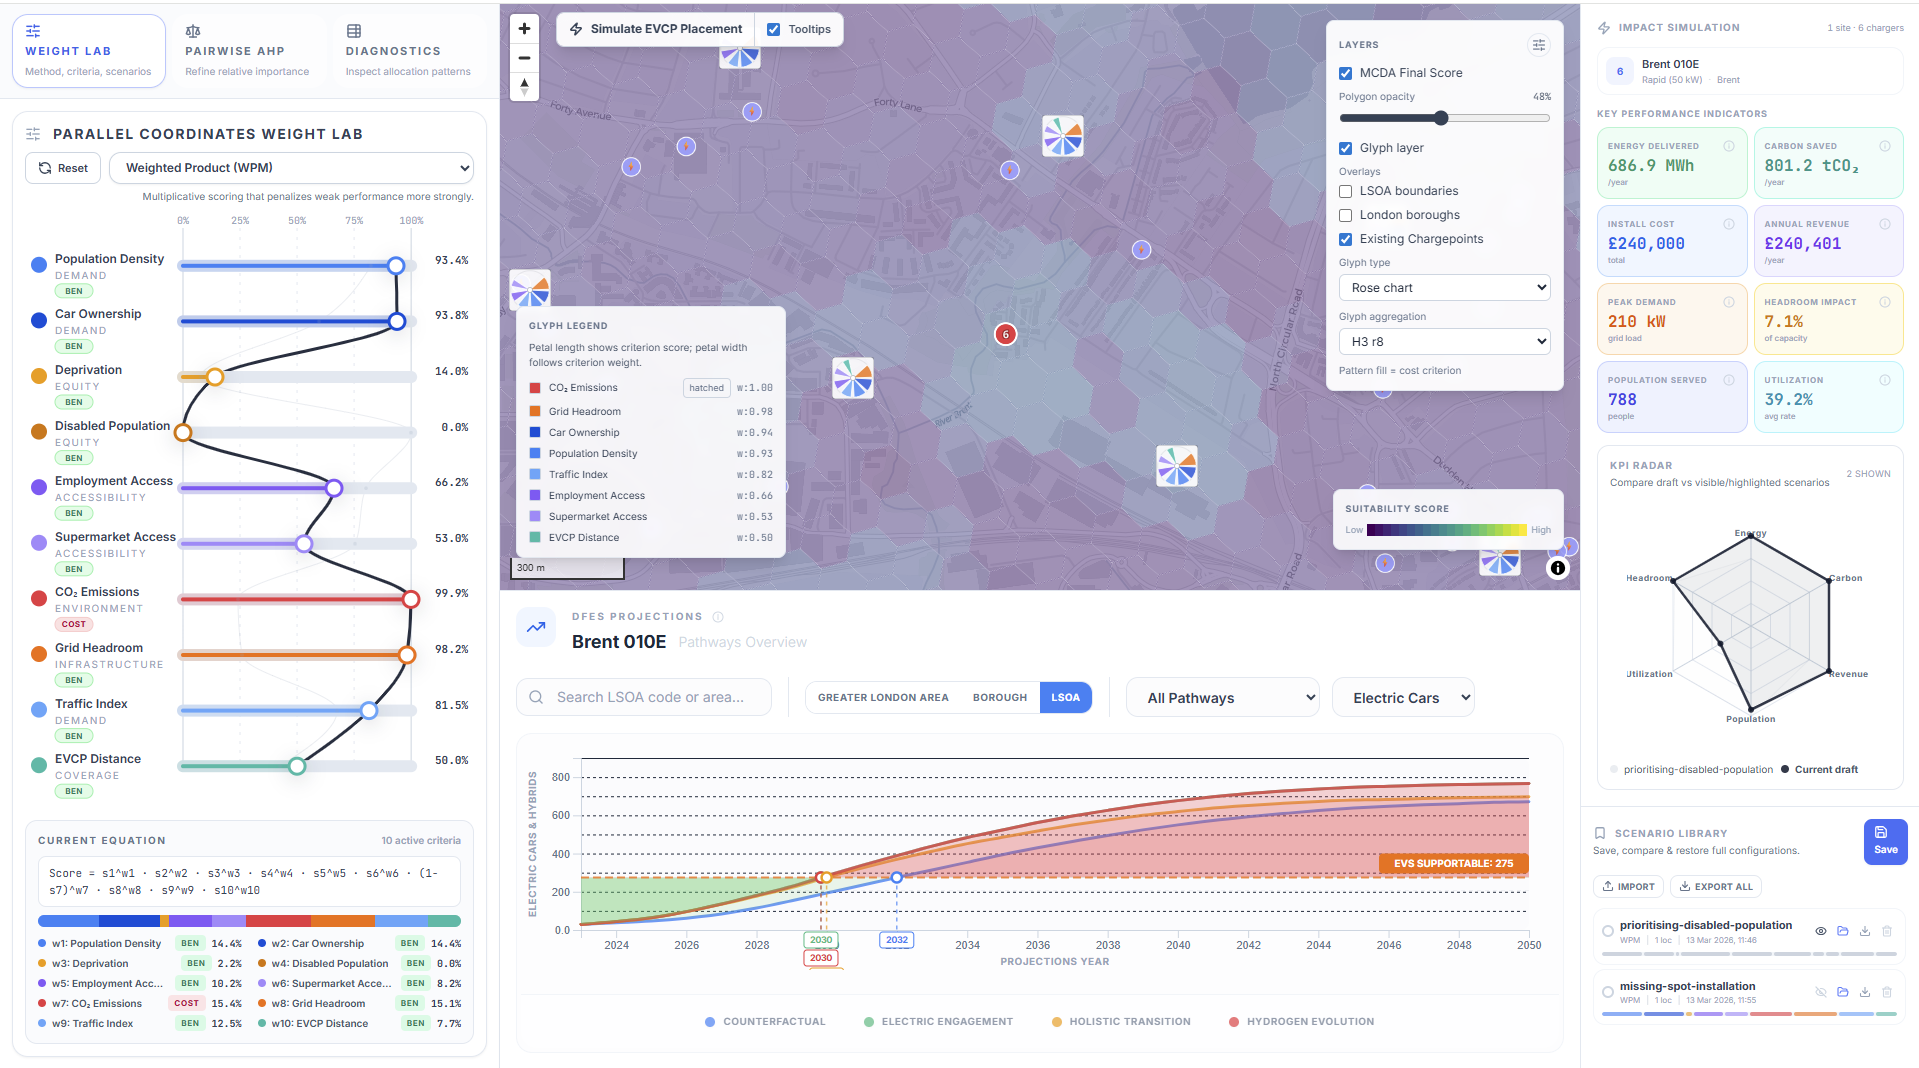
This approach progressed to planning dashboards that make black-box decarbonisation modelling visible and interactive, so users can compose and compare their own scenarios with budgets, low-cost technologies, deployment timing, and multi-scale location data. This includes applications for local authority energy planning and exploratory decision support for EV charging infrastructure siting, as well as research on natural language and LLM-assisted scenario composition.
This portfolio also encompasses multivariate area-based statistical cartography, reusable visualisation study methods, and applied research with industry partners. Together, these studies combine geospatial simulation, multiscale visualisation, and iterative practitioner feedback to create more explainable, actionable, and collaborative decarbonisation strategies.
Personal Projects
Some of my personal projects include:
- Hilal Viewer — interactive, client-side hilal (crescent moon) viewer.
- City Rose Diagram — client-side city rose diagram inspired by Geoff Boeing.
- Indonesia Population Joyplot — animated joyplot of Indonesia’s population density.
- Walking Isochrone — simple route-based walking isochrone explorer.
- Bivariate Choropleth Generator — create custom bivariate choropleth maps.
- HHTSP Solver — hexagonal hierarchical travelling salesman problem demonstration.
- UGM Co-authorship Visualisation — network view of Geodetic Engineering UGM lecturers.
- Scholar Profiler — Google Scholar scraping tool.
- Circular Barplot Generator — create circular barplot visualisations.
- UK Boundaries Downloader — download UK boundary data programmatically.
- Tube Timeline — timeline builder for London tube network history.
- Quick Geodata QA — Streamlit app for rapid geospatial data quality checks.
- Serverless Webmap Experiment — PMTiles + Cloudflare Workers serverless web map demo.